

Optical components: The six billion dollar industry
Chart Watch: Ovum Components
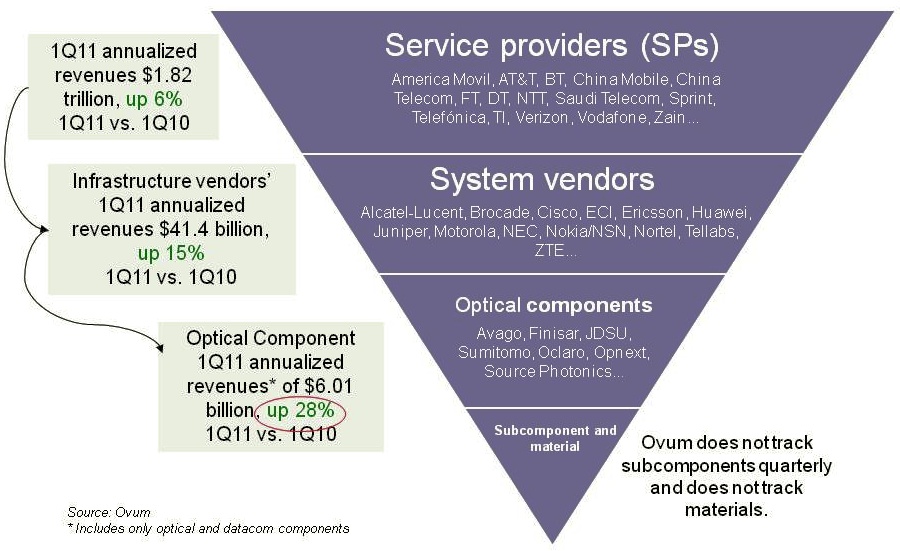
The service provider industry, including wireless and wireline players, is up 6% year-on-year (2Q10 to 1Q11) to reach US $1.82 trillion, according to Ovum. The equipment market, mainly telecom vendors but also the likes of Brocade, has also shown strong growth - up 15% - to reach revenues of over $41.4 billion. But the most striking growth has occurred in the optical components market, up 28%, to achieve revenues of over $6 billion, says the market research firm.
 Source: Ovum
“This is the first time optical components has exceeded six billion since 2001,” says Daryl Inniss, practice leader, Ovum Components. Moreover, the optical component industry growth has continued over six consecutive quarters with the growth being more than 25% for the past four quarters. “None of the other [two] segments have performed in this way,” says Inniss.
Ovum cites three factors accounting for the growth. Fibre-to-the-x (FTTx) is experiencing strong growth while revenues have entered the market from datacom players from the start of 2010. “The [optical] component recovery was led by datacom,” says Inniss. “We speculate that some of that money came from the Googles, Facebooks and Yahoos!.” A third factor accounting for growth has been optical equipment vendors ordering more long lead-time items than needed – such as ROADMs – to secure supply.
 Source: Ovum
The second chart above shows the different market segments normalised since the start of 1999. Shown are the capex spending for optical networking, optical networking equipment revenues, optical components and FTTx equipment spending.
Optical networking spending is some 3.5x that of the components. FTTx equipment revenues are lower than the optical component industry’s and is therefore multiplied by 2.25, while capex is 9.2x that of optical equipment. The peak revenue in 2001 is the optical component revenues during the optical boom.
Several points can be drawn from the normalised chart:
- The strong recent growth in FTTx is the result of the booming Chinese market.
- From 2003 to 2008, the overall market showed steady growth, as illustrated by the best-fit line.
- From 2003 to 2008, capex and optical networking revenues were in line, while two thirds of the optical component revenues were due to this telecom spending.
- From 2010 onwards, components deviated from these two other segments due to the datacom spending from new players and the strong growth in FTTx.
- Once the market crashed in early 2009, optical components, networking and capex all fell. FTTx recovered after only one quarter and was followed by optical components. Optical networking and capex, meanwhile, have still not fully recovered when compared with the underlying growth line.
 Post a Comment
Reader Comments